With the close of 2019, we generated over 40 Zetabytes of data (source) . All of this information was captured, stored and processed for making decisions, complex & simple. Your own product, for example, may be generating millions of rows of data, monthly on Google Analytics alone. As a data oriented product manager, you have to be aware of data sources that can impact your decisions, or provide valuable foresight. And data exists everywhere – in this connected age, every single digital touch-point generates data.
Taking a step back, it helps to organize data sources within your organization. Remember, each data source throws a signal & lots of noise. You should be good enough to differentiate the signal from the noise. Moreover, it is essential to analyze dependance and correlation between these data sources to take better decisions.
Sources of Data
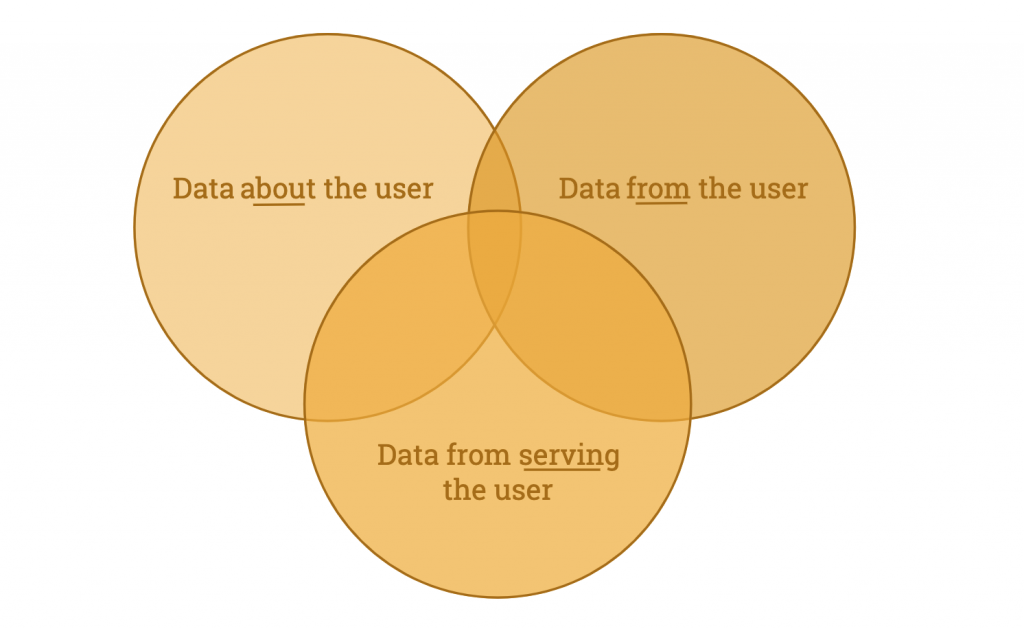
The primary sources of data can be classified in three main scopes:

Here is a brief table that describes each type and their sources & usages:
| Data Type | Description | Benefits of analyzing | Sources |
|---|---|---|---|
| Created by users | Created while interacting with the product. This is the data you want to track and analyze. | Provides journey improvement data points that can improve product experience | Google Analytics, Mixpanel (Any telemetry source) |
| About the user | Data about the users, like their demographic, their preferences and their communication preferences. | Better marketing/targeted communication with the customers. Deep analysis can reveal possible improvements in Customer acquisition costs and overall improvement in Advertising to sales Ratio. | MMPs, Google Analytics, CRM systems etc. |
| Serving the users | Data from operations, customer support, feedbacks, as well as operations data | Improve ambient service. Take expansion and new revenue-stream -adding decisions | Customer feedback tools, operations feedback, store staff feedback |
Of these, note that the first two data categories are usually structured while the last one is rarely structured. Most of the time, it is a “I want…” or “I felt… ” or “We think…”.
Combining data sources
With the data sources categorized, let’s see how analyzing the combinations can lead to better decisions:
Created & About the user
By analyzing data created by the users as a function of data about the user, we stand to create the biggest decision making factor we need as product managers: Personas.
Personas are basically who the users are, and how they behave. Gathering this information is critical to all your product decision making.
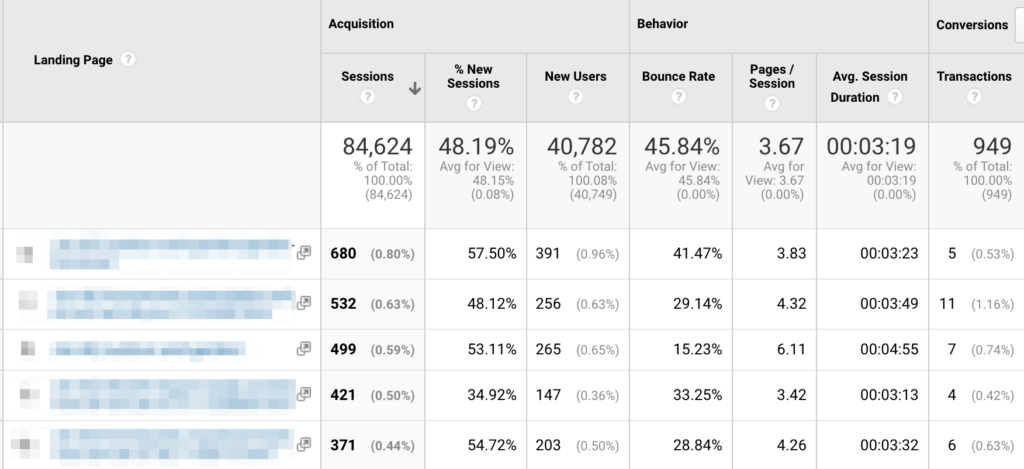
By way of example, here is a sample data from a user behaviour analysis:

As we can see, there is a high bounce rate on the first page of 41%, while page 2 has a lower bounce rate of 30% with a higher transaction count.
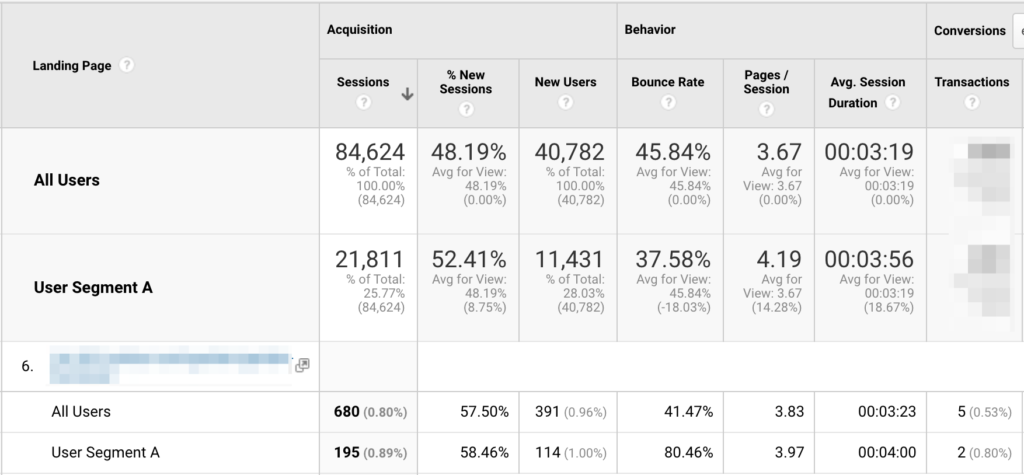
However, if we apply the user segment (derived from marketing & CRM sources):

We see that the high bounce rate was contributed by Segment A (at 80%). The motivations of the user segments can be further analysed – the reality was that that particular segment were mobile users who, while had affinity for the landing page materials, had a poor experience on mobile.
Serving and about the user
Combining the serving and about the user creates an operations persona that is essential to provide a smoother operational experience. E.g. in one of our retail commerce sites, we found that enabling a store-pick up option was convenient for users from a particular area. By creating an operations persona – defining the users behaviour patterns (regular shoppers with a proximity to our stores), we were able to satisfy a need, improve customer service and save costs.
Combining everything
Combining everything – all sources with the right methods – reveals an even more detailed view of the feedback, the behaviour and the revenue from the users. As an example, knowing that the users who provided negative feedback (created by user) on a particular journey, were from a high-spending demographic (about the user) and were high spenders for collect in store option (serving the customer), we were able to prioritize their needs above others and justify to business the reasons for changing certain delivery patterns.
It is important for us to understand that, just like customer journeys on the product, operational & in-store experience has to be personalized. The one-size-fits-all method has grown old and customers are starting to expect more…
Caveats
Data analysis-paralysis is a common problem faced by many product managers. In the face of large data sets with multiple variables, we’re often times locked into making a perfect prediction & classification that will benefit the business. However, coming from experience, I strongly believe that done is better than perfect – in that it is your responsibility to ensure you have something out there based on at least 60% of data, with the provision to improve in the near future. Loosely basing your product ambitions on a selective data set is incorrect, but to spend forever in beating the data till it gives you what you want is wrong too!
Thank you for reading!
If you like this content, you’ll love the Tracking Funnel Timing in Google Analytics! article!

